


Bitcoin Price Crash Explained: February 2026 Deep Dive Into the Ongoing Crypto Downturn
Introduction: What’s Really Happening to the Bitcoin Price in February 2026
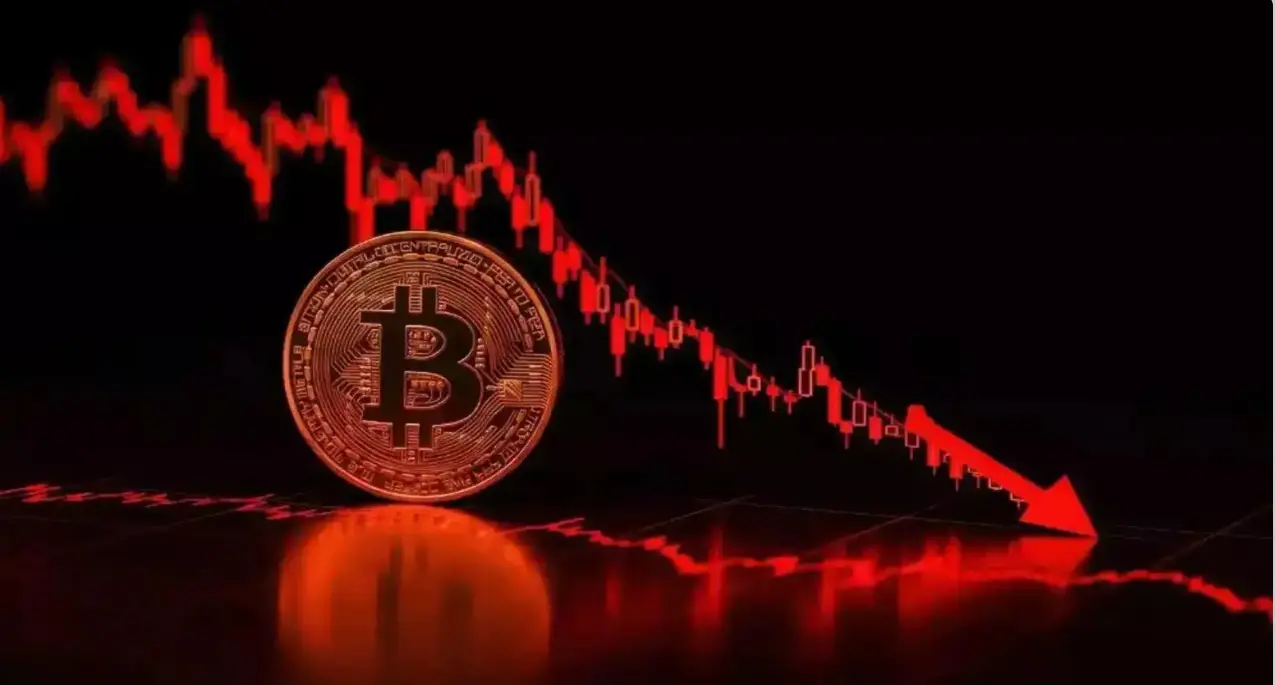
Bitcoin is not experiencing a small dip.
As of February 6, 2026, Bitcoin is in the middle of one of its most severe corrections since the 2022 bear market. After reaching an all-time high near $126,000 in October 2025, the Bitcoin price has fallen roughly 48–50%, wiping out trillions in market value across the broader crypto ecosystem.
What makes this moment different — and more alarming for many investors — is how fast the decline accelerated in early February. What had already been a slow, grinding multi-month downtrend turned into capitulation-style selling between February 4–5, when Bitcoin suffered one of its largest single-day drops in years.
Headlines calling this a “crypto winter” or “market capitulation phase” are no longer exaggerations. But panic-driven narratives rarely explain what actually matters.
This in-depth article provides a clear, factual, and updated Bitcoin price analysis, written for a new website that prioritizes trust, accuracy, and long-term credibility — not hype or fear.
Bitcoin Price Overview: From 2025 All-Time High to February 2026 Lows
Bitcoin’s current position cannot be understood without zooming out.
After the strong 2024–2025 bull cycle — fueled by institutional inflows, ETF momentum, and post-halving optimism — Bitcoin topped out around $126,000 (October 2025). Since then, the market has been undergoing a classic post-euphoria unwind.
Key Phases of the Decline
- November–December 2025: Distribution and lower highs begin
- January 2026: Slow but persistent downtrend, confidence erodes
- Early February 2026: Sharp acceleration into panic selling
This is no longer a short-term pullback. It is a full-scale corrective phase.
Recent Bitcoin Price Timeline (Updated & Accurate) (Bitcoin Price Crash)
Below is a realistic breakdown of Bitcoin’s most recent price action leading into February 6, 2026:
| Date | Approx. Price Range | Market Behavior | Sentiment |
|---|---|---|---|
| Feb 1–2 | $77,000–$79,000 | Weak bounce attempts fail | Cautious, fragile |
| Feb 3 | $73,000–$75,000 | Heavy selling resumes | Growing fear |
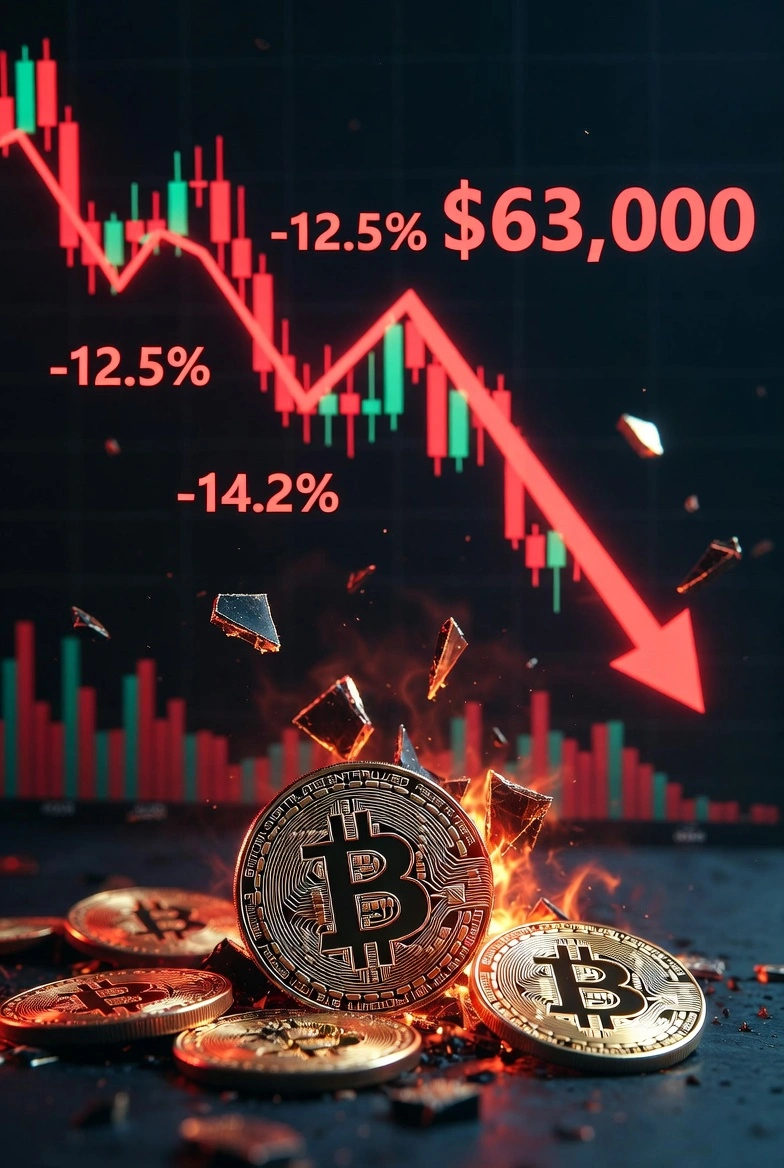
| Feb 4 | $68,000–$70,000 | Support breaks decisively | Panic begins |
| Feb 5 | ~$60,000–$63,000 (intraday low) | One of largest daily drops since 2022 | Capitulation |
| Feb 6 (now) | ~$63,000–$66,000 | Volatile bounce attempts after intraday lows near $60k | High uncertainty |
This move erased months of price structure in days, a classic sign of forced selling and leverage unwind.

Why Did the Bitcoin Price Crash So Hard? (The Real Drivers)
There is no single villain behind this crash. Instead, multiple pressures converged at the worst possible time.
1. Post-Bull-Market Exhaustion
Every Bitcoin bull cycle ends the same way:
- Excess leverage
- Overconfidence
- Late retail participation
By late 2025, speculative activity had reached unsustainable levels. When momentum slowed, the unwind was inevitable.
2. Macro-Economic Stress & Liquidity Tightening
Despite Bitcoin’s decentralized nature, it remains highly sensitive to global liquidity conditions.
Key pressures include:
- High interest rates staying elevated longer than expected
- Strong US dollar reducing risk appetite
- Weakness across global equity markets
- Reduced institutional risk exposure
When liquidity dries up, Bitcoin reacts faster and more violently than traditional assets.
3. Leverage, Liquidations, and Forced Selling (Bitcoin Price Crash)
The February crash was heavily amplified by derivatives markets.
As prices fell:
- Long positions were liquidated en masse
- Forced selling hit spot markets
- Stop-loss cascades accelerated downside
This is why Bitcoin can drop 10–15% in a single day — not because fundamentals changed overnight, but because leverage snapped.
Is This a Crypto Winter or a Temporary Panic?
Many analysts now openly describe the current environment as a crypto winter phase, defined by:
- Prolonged drawdowns
- Reduced retail participation
- Negative sentiment dominating headlines
- Capital rotation out of speculative assets
However, “crypto winter” does not mean collapse. Historically, it has meant rebuilding.
Bitcoin Price vs Historical Crashes (Perspective Still Matters)(Bitcoin Price Crash)
Even this brutal correction fits within Bitcoin’s long-term behavior.
| Cycle | Peak-to-Trough Drop | Context | Long-Term Outcome |
| 2013 | ~80% | Early infrastructure failures | New ATHs later |
| 2017–18 | ~84% | ICO bubble burst | Multi-year recovery |
| 2020 | ~50% | Global crisis | Fastest rebound |
| 2022 | ~75% | Rate hikes, collapses | Market reset |
| 2025–26 | ~48–50% (so far) | Post-ATH unwind + macro stress | Still unfolding |
Bitcoin has never avoided deep corrections — and has never skipped them.
Bitcoin vs Traditional Assets During This Crash
Bitcoin vs Stock Markets
| Aspect | Bitcoin | Stocks |
| Drawdown speed | Extremely fast | Gradual |
| Trading hours | 24/7 | Limited |
| Volatility | Very high | Moderate |
| Reaction to fear | Immediate | Delayed |
Bitcoin often reflects risk-off sentiment before equities fully price it in.
Bitcoin vs Gold
| Aspect | Bitcoin | Gold |
| Volatility | High | Low |
| Growth potential | High | Limited |
| Risk profile | Speculative | Defensive |
| Behavior in stress | Sharp drops | Stability |
Gold protects wealth. Bitcoin tests conviction.
On-Chain Reality: What Long-Term Holders Are Doing
Despite the crash, blockchain data suggests:
- Long-term holders are not panic selling
- Coins held for years remain mostly dormant
- Selling pressure is dominated by short-term participants
This pattern has appeared in every major Bitcoin drawdown.
Media Panic vs Market Mechanics
Current headlines include:
- “Bitcoin crashes to $60,000”
- “Worst crypto sell-off since FTX”
- “Trillions wiped from digital assets”
While emotionally powerful, headlines rarely explain:
- Leverage mechanics
- Market cycles
- Liquidity dynamics
Understanding these differences separates reactive investors from prepared ones.
Is This a Good Time to Buy Bitcoin?
There is no universal answer — especially now.
Long-Term Investors
Potential positives:
- Prices far below ATH
- Reduced hype
- Historically strong accumulation zones forming
Risks:
- Further downside possible
- Emotional strain
Short-Term Traders
Current environment is extremely risky:
- Violent volatility
- Unclear trend direction
- News-driven swings
Survival matters more than profit during capitulation phases.
What Could Happen Next? (Realistic Scenarios)
Scenario 1: Extended Consolidation
Bitcoin ranges between $55k–$70k, volatility slowly decreases, confidence rebuilds.
Scenario 2: Deeper Washout
Macro stress worsens, Bitcoin tests $40k–$50k before long-term buyers step in.
Scenario 3: Sharp Relief Rally
Short squeezes trigger fast upside, but recovery remains uneven.
Markets move on probabilities — not certainties.

How to Read Bitcoin Price Action During a Crash
Focus on:
- Risk management
- Time horizon clarity
- Position sizing
Avoid:
- Emotional trades
- Excess leverage
- Blind predictions
Final Thoughts: What This Bitcoin Price Crash Really Represents
This is not Bitcoin’s end.
It is a reset — painful, humbling, and historically necessary.
Every Bitcoin cycle:
- Rewards patience
- Punishes excess
- Forces perspective
For a new website, publishing accurate, calm, deeply researched content like this is exactly how long-term trust is earned — with readers and with Google.
Follow On ” X“


Rolls-Royce Stock 2026: Why Shares Are Hitting Record Highs & Forecast Insights
Bitcoin Price Crash: Why BTC Fell Nearly 50% in February 2026